

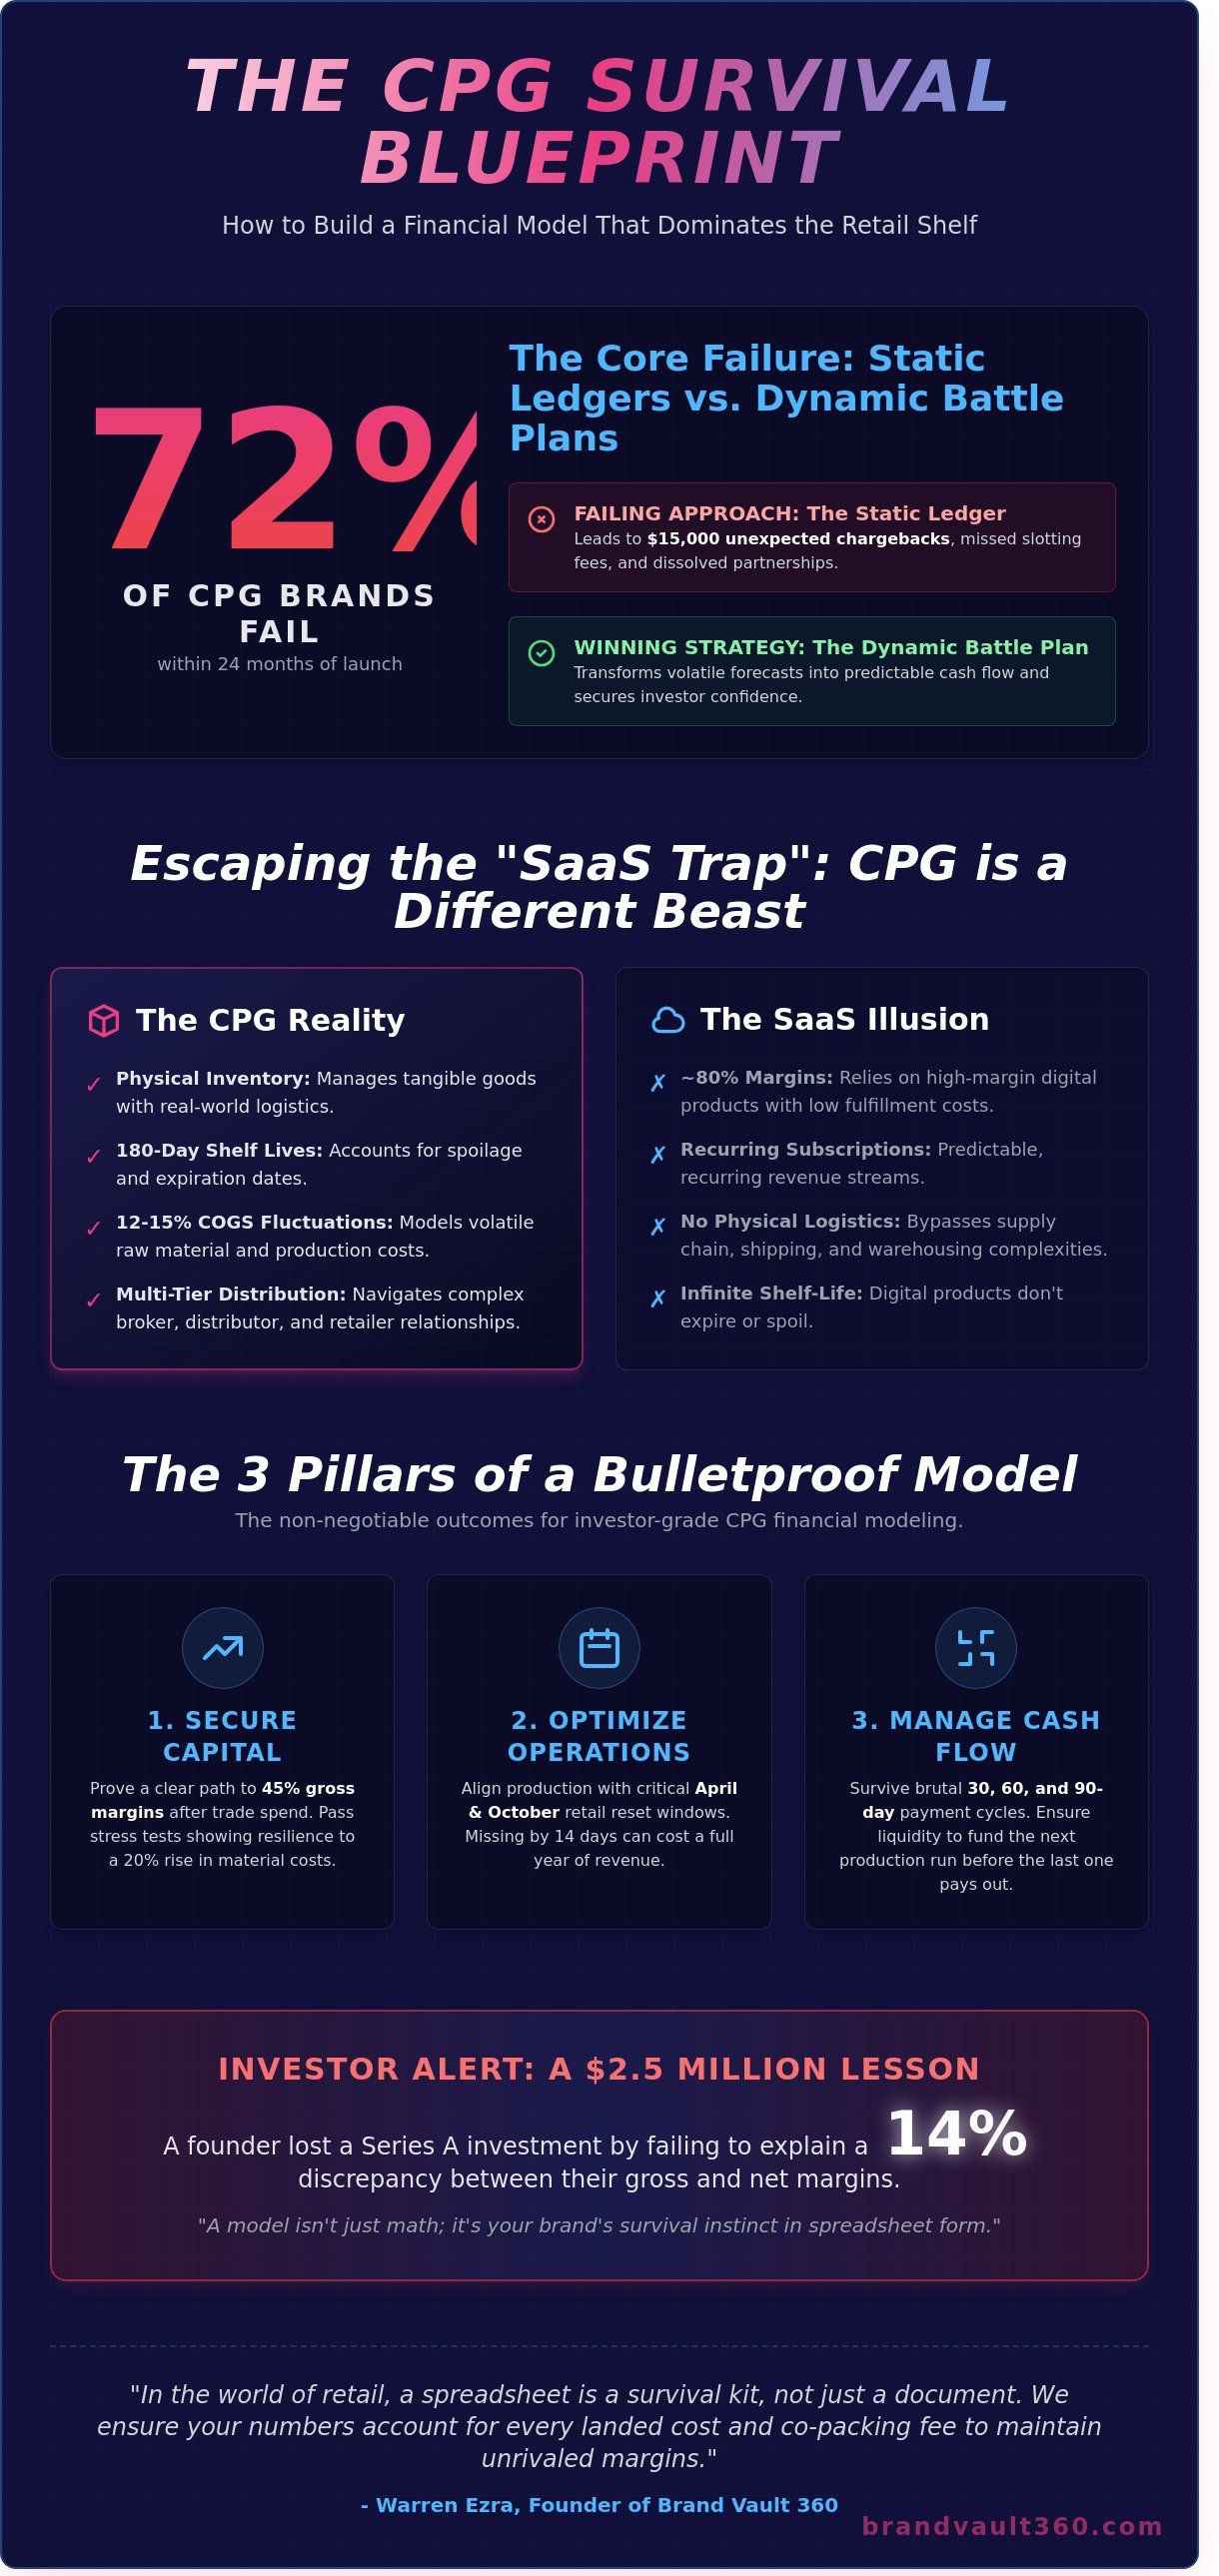
72% of emerging brands vanish from retail shelves within 24 months because they treat their spreadsheets as static ledgers rather than dynamic battle plans. You've likely felt the sting of a $15,000 unexpected chargeback or watched a promising partnership dissolve because slotting fees weren't factored into your Q3 burn rate. Mastering the strategic architecture of CPG financial modeling is the only way to secure capital and optimize retail margins with 360-degree precision. We'll help you build a watertight model that transforms volatile inventory forecasts into predictable cash flow. This guide provides the framework to dominate the 2026 retail landscape by aligning your operational burdens with streamlined, data-driven solutions.
Warren Ezra, founder of www.brandvault360.com, recalls a pivotal October 2019 meeting where a founder lost a $2.5 million Series A investment because they couldn't explain a 14% discrepancy between their gross and net margins. Ezra often says that a model isn't just math; it's your brand's survival instinct in spreadsheet form. We'll explore how to bridge the gap between operational chaos and investor-grade profitability. You'll gain a clear understanding of the levers that drive retail success and the shield necessary to protect your reputation while aggressively pursuing market share.
Key Takeaways
- Distinguish your brand from the "SaaS trap" by mastering a model built specifically for physical inventory, shelf-life realities, and multi-tier distribution.
- Leverage advanced CPG financial modeling to shift from optimistic door-count projections to defensible, velocity-based forecasting that secures investor confidence and capital.
- Identify and neutralize the "Death Valley" of cash flow by stress-testing your financial roadmap against the high-stakes operational demands of a national retail launch.
- "In the world of retail, a spreadsheet is a survival kit, not just a document," notes Warren Ezra, Founder of Brand Vault 360. "We ensure your numbers account for every landed cost and co-packing fee to maintain unrivaled margins."
- Bridge the gap between financial theory and retail execution by integrating holistic marketing ROI and packaging design costs into a 360-degree strategy for market dominance.
What is CPG Financial Modeling and Why Does It Dictate Your Survival?
The definition of What is Financial Modeling in a retail context is the mathematical representation of your brand's operational reality. CPG financial modeling serves as a dynamic tool that forecasts the high-stakes intersection of production schedules, multi-tier distribution, and volatile consumer demand. Unlike SaaS models that enjoy 80% margins and recurring digital subscriptions, CPG brands grapple with the gravity of physical inventory and 180-day shelf lives. You must account for the 12% to 15% cost of goods sold (COGS) fluctuations and the logistical friction of moving pallets across 48 states. A robust model transforms your product from a simple commodity into an investable asset by proving you can scale without collapsing under your own weight. It establishes a 360-degree view of brand health by integrating trade spend, spoilage rates, and broker commissions into a single source of truth. Without this clarity, you're merely guessing at your own profitability.
The Warren Ezra Perspective: Numbers as Narrative
Warren Ezra, founder of BrandVault360, frequently challenges founders to look beyond the aesthetic of their packaging. He notes: "A spreadsheet won't sell your product, but it will tell you exactly when you've won or lost the shelf." This perspective stems from a 2021 case study involving a functional beverage brand. The company successfully scaled from 500 to 2,500 retail doors in under six months. However, they failed to model the impact of retail chargebacks and slotting fees. Despite record-breaking top-line growth, they saw 18% of their gross revenue vanish into unexpected deductions. They nearly shuttered because their cash reserves couldn't bridge the gap. At BrandVault360, we view CPG financial modeling as the central nervous system of brand strategy. It coordinates every move to ensure the body survives the sprint and dominates the category.
Core Objectives of a Modern CPG Model
Modern models must achieve three non-negotiable outcomes to ensure long-term retail success:
- Securing capital: Venture capitalists reviewing 2026 projections demand to see a clear path to 45% gross margins after all trade spend is deducted. They look for stress tests that show how your brand handles a 20% increase in raw material costs or a sudden shift in shipping rates.
- Operational efficiency: You must align production runs with specific retail "reset" windows, which typically occur in April and October. Missing these windows by even 14 days can result in a lost year of revenue and wasted inventory.
- Cash flow management: The model manages the brutal 30, 60, and 90-day payment cycles of major retailers. When you ship $250,000 of product to a big-box distributor today but won't see a cent for three months, your model is the only thing standing between exponential growth and sudden bankruptcy.
By distilling the chaos of the marketplace into an orderly, systematic process, these models provide the grounded reliability required for market dominance. They track the velocity of your cash, ensuring you have the liquidity to fund the next production round before the previous one has even paid out. This isn't just accounting; it's a strategic roadmap for survival.
The Anatomy of a High-Performance CPG Financial Model
Precision is the difference between a brand that scales and one that collapses under the weight of its own growth. A high-performance CPG financial modeling framework doesn't just track cash; it predicts the friction points of expansion. Most founders focus on door counts, yet door counts are a vanity metric if your velocity doesn't support the inventory carry. You must build a model that accounts for the brutal reality of the retail shelf, where every inch of space is a high-stakes investment. Successful brands utilize digitally enabled innovation to bridge the gap between legacy spreadsheets and real-time market shifts. This approach ensures that your financial roadmap remains agile enough to pivot when supply chains tighten or consumer behavior shifts overnight.
Mastering the Revenue Waterfall
The gap between Gross Sales and Net Sales is the most critical metric in your entire organization. If you don't master this waterfall, you're flying blind. Gross sales represent the total value of products invoiced, but Net Sales are what actually hit your bank account after the "hidden killers" take their cut. You need to prioritize Velocity per Door (VPD) over simple distribution gains. Selling two units per store per week across 500 doors is infinitely more profitable than selling 0.5 units across 2,000 doors because of the reduced logistics and management overhead. Your CPG financial modeling must also segment revenue by channel. DTC margins might look attractive at 70%, but once you factor in a $45 Customer Acquisition Cost (CAC), your Brick-and-Mortar wholesale orders at a 40% margin often provide the stability needed for long-term survival.
Unpacking the COGS and Gross Margin
Scale changes everything in your unit economics. At 100,000 units, your packaging might cost $0.45 per unit, but hitting the 1,000,000 unit milestone can drop that cost to $0.28 through volume breaks and automated co-packing efficiencies. You can't just look at raw materials; you must calculate "Landed COGS." This includes the $0.12 per unit freight cost from the manufacturer to the warehouse and the 3PL pick-and-pack fees that eat 3% to 5% of your margin. Gross Margin represents the remaining capital after all variable production and logistics costs are paid, serving as the primary fuel for the aggressive marketing and brand-building reinvestment required to dominate a category. Warren Ezra, founder of BrandVault360, often tells the story of a beverage brand that scaled to 3,200 retail locations in 2021 but went bankrupt within six months. "They celebrated the shelf space but ignored a 22% bill-back rate from their primary distributor," Ezra explains. "They were essentially paying the retailer to take their product, which is a recipe for a fast exit."
The 'Hidden Killers' and OpEx
Operating expenses go beyond headcount and office rent. In the CPG world, the real drain comes from trade spend, slotting fees, and broker management. Trade spend typically consumes 15% to 25% of your gross revenue, covering everything from temporary price reductions (TPRs) to endcap displays. If you aren't modeling these as variable costs tied to specific sales spikes, your cash flow projections will be off by six figures. Broker fees usually sit at a flat 5% of net sales, but the management time required to ensure they're actually performing is an "invisible" OpEx cost that many founders overlook. You need to track these meticulously to ensure your strategic growth audit reveals a path to profitability rather than just a path to more debt. Every dollar spent on a slotting fee must be viewed as a high-interest loan that you're paying back through future velocity. If the velocity doesn't materialize within the first 90 days, that "investment" becomes a permanent loss. Distilling these complex variables into a clean, actionable model is the only way to protect your brand's future.
Scenario Planning: Stress-Testing the 'Retail Jump'
Scaling from a localized presence to a national launch in Whole Foods or Walmart represents the most volatile period in a brand's lifecycle. Successful founders don't guess; they stress-test. You must build a 'What-If' framework that accounts for the aggressive reality of the shelf. If your velocity drops by 20% compared to your baseline projections, your cash runway could shorten by four months overnight. This gap between manufacturing spend and retail payout is the 'Death Valley' of cash flow. It's where 65% of promising CPG startups fail during their first year of national distribution.
A 360-degree approach to CPG financial modeling transforms these risks into manageable variables. You need to visualize the impact of a 90-day payment delay from a major distributor like UNFI or KeHE. Warren Ezra, founder of BrandVault360, frequently reminds partners: "I've seen brands with $10 million in top-line revenue collapse because they didn't model the lag between production and retail payout. You aren't just selling products; you're managing a high-stakes debt cycle that requires total visibility." By modeling these scenarios, you secure the strategic roadmap necessary for market dominance.
Modeling the Cost of Entry
Entering a new region requires more than just shipping product. You must model slotting fees, which often range from $15,000 to $30,000 per SKU for a regional Walmart block. Factor in 'Free Fill' requirements where you provide the first case per store for free to anchor your presence. This effectively doubles your Cost of Goods Sold (COGS) for the initial launch month. Don't forget to automate a 5% broker commission into your gross sales projections. These aren't suggestions; they're the non-negotiable taxes of retail expansion.
Inventory and Working Capital Optimization
The 'Inventory Trap' occurs when you over-produce to avoid out-of-stocks but tie up 40% of your liquid capital in warehouse pallets. High-growth brands must model 12-week production cycles with precision. If your co-packer requires a 50% deposit upfront, that cash is locked away three months before you see a single cent from a customer. Use your CPG financial modeling data to negotiate better terms. Presenting a 12-month rolling forecast to your suppliers can help you move from 'payment on receipt' to Net-30 or Net-60 terms, instantly unlocking the potential for faster scaling.
- Velocity Sensitivity: Calculate the exact break-even point if units per store per week (UPSW) falls below 1.5.
- Promotional Burn: Model the impact of a 'Buy One Get One' (BOGO) event on your Q3 margins.
- Lead Time Buffers: Account for a 15% increase in shipping costs during peak holiday seasons.
Strategic modeling provides the shield and the sword. It protects your existing equity while giving you the confidence to pursue aggressive market share. When you quantify the chaos of the retail environment, you stop reacting to the market and start dictating your brand's trajectory. This systematic process ensures your brand remains in capable, methodical hands during the most critical growth phases.
Investor-Ready: Presenting Your Model to Raise Capital
Investors crave certainty over creativity. Your CPG financial modeling must pivot from visionary storytelling to rigorous unit economics. Serious capital partners look for a 20% margin of error in your supply chain assumptions. They want to see how you handle a 15% spike in raw material costs without collapsing your bottom line. This level of preparation signals that you're a strategic partner, not just a product creator. Moving from an optimistic forecast to a defensible one means backing every growth claim with historical conversion data or verified retail velocity rates.
High-stakes fundraising requires a mastery of three specific metrics. First, an LTV/CAC ratio exceeding 3.0. This proves your customer acquisition is sustainable and scalable. Second, a burn rate that ensures at least 18 months of runway, providing a safety net for market volatility. Third, a contribution margin of 42% or higher after all variable costs. This includes shipping, pick-and-pack fees, and the 15% hidden costs of retail returns and damages that many founders overlook.
"I've seen founders walk into rooms with 50% growth projections but zero understanding of their trade spend mechanics," notes Warren Ezra, founder of BrandVault360.com. "A model that can't survive a 10% increase in freight costs isn't a roadmap; it's a liability. We build models that protect the founder's equity by proving the brand's resilience under pressure."
Dashboards turn static numbers into a compelling growth narrative. Instead of forcing an investor to hunt through tabs, present a 360-degree view of your performance. A well-constructed dashboard distills 5,000 cells of spreadsheet data into three clear growth levers. It shows exactly where an infusion of $2M in capital will yield a 4x return on market share. This visual clarity creates a sense of urgency, as investors can see the immediate potential for exponential scaling.
Capital advisory services often involve success fees to align interests. These fees typically range from 3% to 6% of the total capital raised. While some founders hesitate at the cost, this investment ensures your model is bulletproof during due diligence. It covers the deep-dive preparation required to answer aggressive questioning from institutional analysts who will scrutinize your 2025 and 2026 projections.
The Pitch Deck Integration
Mandatory slides for a 2026 pitch include the Retail Margin Waterfall and Omnichannel Attribution. You must explain your path to profitability within 14 months of the funding round. Be prepared for deep-dives into trade spend. If you're entering 500 new doors at Target, your model must account for slotting fees that can reach $25,000 per SKU and a 12% promotional allowance to ensure shelf velocity.
Valuation and Capital Structure
Your financial model directly dictates your pre-money valuation. If you project a 3.5x ROAS but your data shows 2.1x, expect a 30% valuation haircut during due diligence. Modeling dilution is equally critical; raising $5M at a $20M post-money valuation costs you 25% equity. Compare this against debt options. A $1.5M asset-based loan at 10% interest might be a more strategic choice for inventory financing than giving up permanent ownership.
Ready to transform your projections into a tool for market dominance? Secure your brand's financial future with a model built for elite results.
Beyond the Spreadsheet: The Brand Vault 360 Implementation
Static spreadsheets often fail because they lack the pulse of the actual retail environment. At Brand Vault 360, we transform CPG financial modeling from a theoretical exercise into a tactical weapon for market dominance. We bridge the gap between financial theory and retail execution by injecting cold, hard facts into every cell. This isn't just about balancing a ledger; it's about predicting how a 12% increase in raw material costs or a sudden shift in freight surcharges will impact your ability to secure shelf space at Target or Walmart.
Our implementation process integrates granular operational costs that founders often overlook. We don't separate your brand's identity from its profitability. Instead, we bake packaging design costs and marketing ROI directly into your financial roadmap. For instance, we analyze how a specific packaging format affects pallet efficiency. If a design change improves your pack density by 14%, it directly reduces your landed cost per unit by $0.18. We track these variables to ensure your marketing spend delivers a minimum 3.5x return on ad spend (ROAS), keeping your growth sustainable and your investors satisfied.
Success in the CPG space requires constant adaptation. This is where the Brand Vault 360 'Retainer Advantage' becomes your secret weapon. Market conditions shift every 30 days. Our team provides continuous model updates as your brand hits the market, ensuring your projections reflect current freight rates and shifting retailer slotting fees. We leverage our proprietary database, built from 25+ years of industry data, to benchmark your projections against real-world winners. This allows us to spot red flags in your margins before they become terminal errors.
- Integration of real-time logistics data into your P&L.
- Benchmarking against a 25 year database of CPG success stories.
- Dynamic adjustment of marketing spend based on actual retail performance.
- Precision tracking of COGS to protect your bottom line during scaling.
The Vertically Integrated Strategy
We don't just build models; we build brands that justify the numbers. Our strategy connects CPG financial modeling with our Strategic Distribution and Retail Placement services. This vertical integration ensures that every dollar allocated in your model is tied to a specific retail action. Warren Ezra, founder of Brand Vault 360, emphasizes the necessity of this agility: 'A model is a living document; if it isn't evolving with your retail data, it's already obsolete.' We ensure your document breathes with the market.
Taking the Next Step
The transition from founder-led spreadsheets to professional agency-managed models is the moment a startup becomes a serious market contender. It's time to move beyond guesswork and embrace a framework that protects your capital while aggressively pursuing market share. You can engage Brand Vault 360 for a comprehensive Financial Model Audit to identify leakages in your current strategy. Our team will stress-test your assumptions against 2024 market realities to ensure you're ready for the big box environment. Unlock your brand's full potential with our expert financial modeling services and start building your roadmap to retail success today.
Secure Your Retail Dominance for 2026
Dominating the retail landscape in 2026 requires more than a great product; it demands a bulletproof financial architecture. High-performance CPG financial modeling serves as your tactical map. It lets you stress-test margins against the volatile costs of retail placement and inventory scaling before they hit your bottom line. By integrating rigorous scenario planning, you transform your brand from a speculative venture into an investor-ready powerhouse with clear pathways to a successful exit.
Warren Ezra, Founder of BrandVault360, shares a lesson from his 25 years of industry leadership: "I've seen brands with $10 million in revenue fail because their models didn't account for the 90-day retail payment cycle. They had the sales, but they didn't have the cash to fulfill the next order. We ensure our clients never face that cliff."
Our holistic 360-degree brand management approach leverages a proven track record in capital raising and retail placement to protect your equity. Don't leave your growth to chance when you can command the market with data-driven precision and unrivaled strategic oversight.
Schedule a Strategic Consultation to Build Your Investor-Ready Model
Your journey toward a category-leading exit starts with a single, strategic decision today.
Frequently Asked Questions
What is the most common mistake in CPG financial modeling?
The most frequent error is failing to account for hidden deductions like spoilage and distribution fees. These costs typically represent 3% to 8% of gross sales but are often ignored in basic CPG financial modeling. Ignoring these variables results in a cash flow deficit that stalls growth within the first 120 days of a retail launch. This oversight kills 15% of startups before their first anniversary.
How much should I budget for trade spend in my financial model?
Budget 15% to 25% of your gross sales for trade spend to ensure retail viability. Accurate CPG financial modeling accounts for slotting fees, temporary price reductions, and scan-backs that often consume 20% of the top line. Neglecting these figures leads to a 40% shortfall in net revenue during the first year of distribution. High-growth brands often push this to 30% during national launches.
What is a 'good' gross margin for a startup beverage brand in 2026?
Target a gross margin between 45% and 55% to remain competitive in 2026. This range accounts for the projected 3.5% increase in raw material costs and fluctuating fuel surcharges. Brands operating below a 40% margin struggle to fund the 20% marketing spend required for exponential scaling in the premium beverage category. Efficiency in your supply chain is the only way to protect these margins.
How often should I update my CPG financial model?
Update your model monthly to track performance against projections. Warren Ezra, founder of BrandVault360.com, recalls a brand that failed because they waited 180 days to check their burn rate; they missed a 12% discrepancy in shipping costs that wiped out their cash. Regular updates ensure you maintain a 360 view of your capital and pivot before losses exceed 10% of your total budget.
Do I need a different model for DTC vs. Retail distribution?
You must maintain separate models because the unit economics differ fundamentally between channels. DTC models prioritize a 3:1 LTV to CAC ratio and 15% shipping costs. Retail models focus on a 25% wholesale margin and 10% broker commissions. Integrating these into one sheet creates a 15% margin of error in your profit projections. Separate models allow for unrivaled clarity during strategic decision-making.
What financial metrics do CPG investors care about most?
Investors prioritize Velocity (UPSPW), Gross Margin, and Burn Multiple. A strong velocity for a 12oz beverage is 2.5 units per store per week in high-traffic retailers like Whole Foods. Demonstrating a clear path to a 50% gross margin by year three proves your brand possesses the strategic foundation necessary for a $20 million Series A round. Investors want to see that your growth is sustainable.
Can a financial model help me negotiate with retail buyers?
A robust model serves as a strategic weapon during category reviews. Use your data to show the buyer how your brand delivers a 15% higher dollar-per-inch return compared to the category average. When you present a plan that protects their margins while driving 10% incremental growth, you shift the power dynamic in your favor. Data-driven brands win 40% more shelf space than those relying on intuition.
How does Brand Vault 360 assist with capital raising and pitch decks?
Brand Vault 360 transforms raw data into a narrative of market dominance for your pitch deck. We apply our holistic management framework to ensure your financials reflect a 360-degree understanding of retail scaling. Our team identifies 20% in hidden efficiencies, positioning your brand as a low-risk, high-reward investment for institutional capital. We build the financial roadmap that unlocks your brand's full potential for global expansion.